
Updata Newsletter – Q4 2026
Technical Analysis, Price Targets and the market outlook from David Linton
Welcome to the Updata Quarterly Newsletter and what a quarter Q3 has been. I gave several in-house client training courses in Europe, including one at Drax, a long standing Updata client. This also included a fascinating tour of the UK’s biggest power station. We are working with clients analysing energy markets each and every day. European Gas and Electricity prices have been making new multi-year highs as the charts have predicted. Bond markets have been in turmoil but stocks have held up with the weight of money supporting the AI revolution. We will look at chart themes for the coming months in this issue with Q4 Market Outlook

David Linton, Updata founder
Apple v Nvidia – the battle for the top spot between the world’s two biggest companies – read below

September saw the launch of ‘Predicting the Price.’ Three years’ work in the making. This has been very well received with several 5-star reviews on Amazon. The book is in Hardback and Kindle. There are UK and US English editions, so make sure you order the right one.
The book comes with a Free 3-hour webinar giving further candid explanation of every diagram and chart in the book. Simply paste in your Amazon order number for free access at www.predictingtheprice.com
Training and Events
Charts Today is FREE every weekday at www.chartstoday.com
Join us each day as we run through the latest changes we are seeing in financial markets. This 10-minute run-through of the charts keeps you up to speed with all that is happening as well as brushing up your TA skills.
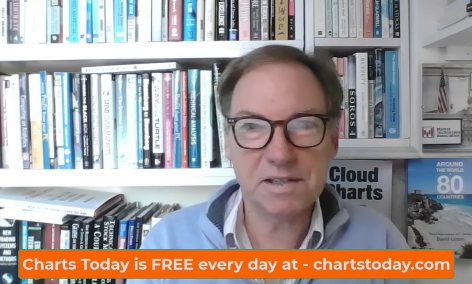
Watch the monthly LSEG Masterclass Webinars at www.updata.co.uk/LSEGmasterclass
The London Stock Exchange Group hosts David Linton’s Technical Analysis Masterclass webinar on the third Friday of every month. There is a live morning session for Asia and Europe and an afternoon session for Europe and the Americas. These live sessions are for market professionals only, but Updata makes recordings available on the Updata website. Each session focuses on a TA subject in detail. Professional users can register for the live sessions direct with the LSEG Academy – search David Linton. For the recorded sessions see the Resources Tab on the Updata website.

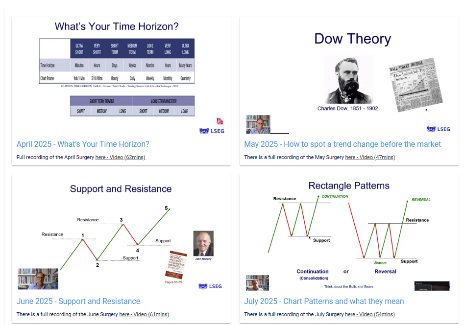
More free resources at www.updata.co.uk/Resources
In the Resources section of the Updata website you will find: academic papers, articles, book reviews, demo videos, interviews, multiple choice knowledge tests and more.
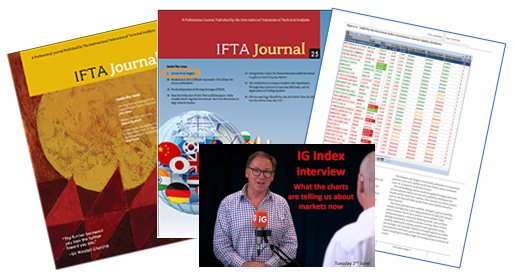


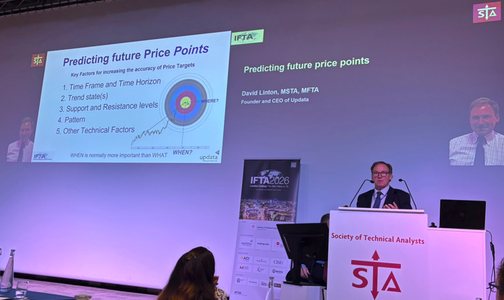
International Federation of Technical Analysts – Annual Conference 2026 - London
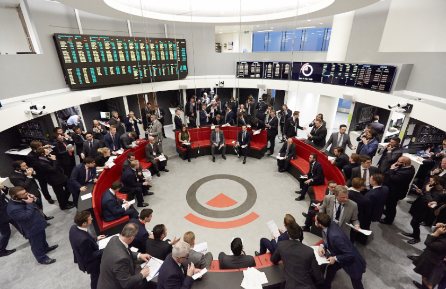
IFTA is a global Technical Analysis organisation with member societies in 23 countries. This year’s conference was hosted by the UK Society of Technical Analysts 9-10th October in London. There was a brilliant line up of top speakers from all over the world. They enjoyed a rare visit to the London Metal Exchange open outcry trading floor ahead of the conference.
Conference topics covered included:
- Relative Strength and Sector Rotation
- Systematic Portfolios and Automated Trading
- Price Targets
- Market Profile
- Global Macro Analysis


Inevitably, there was a very big emphasis on AI.

David Linton awarded Fellowship of the UK Society of Technical Analysts
At the IFTA conference drinks reception, David Linton was awarded a Fellowship of the STA (FSTA) in recognition of his contribution to Technical Analysis and the STA. David has taught part of the STA Diploma for many years and has sat the CFTe and MSTA exams. He also holds a Master of Financial Technical Analysis (MFTA) awarded by IFTA and he is one of four IFTA Goodwill Ambassadors.
IFTA conferences are special and enduring friendships are built. Next year’s conference is in New York.
The conference recordings and slides are available for purchase from the STA - Here
Intensive Technical Analysis Training Courses
Free resources are useful but if you want to truly master Technical Analysis an intensive course is best. Updata offers a 12-hour, 8 module on-line course which is updated every year.
Tailored Training for Professional Trading Teams
These courses are put together to suit a firm’s specific needs. They are normally delivered in-house but a combination of on-line theory and live webinar is also possible. Here every course is different as no two firms are the same. We have coached traders and analysts in hundreds of firms in over 30 countries. We will come to you!

After six months, I still use what I learnt on the course every day in my analysis and trading. It has been excellent for spotting trends and changes which has helped us position ourselves in the market more favourablyEnergy Trader, London
Upcoming Events in London this Quarter
David is speaking at two events in London in October. He will be at the London Prop Trading Expo on Friday 23rd October and the London Investor Show on Friday 30th October. Come and say hi!


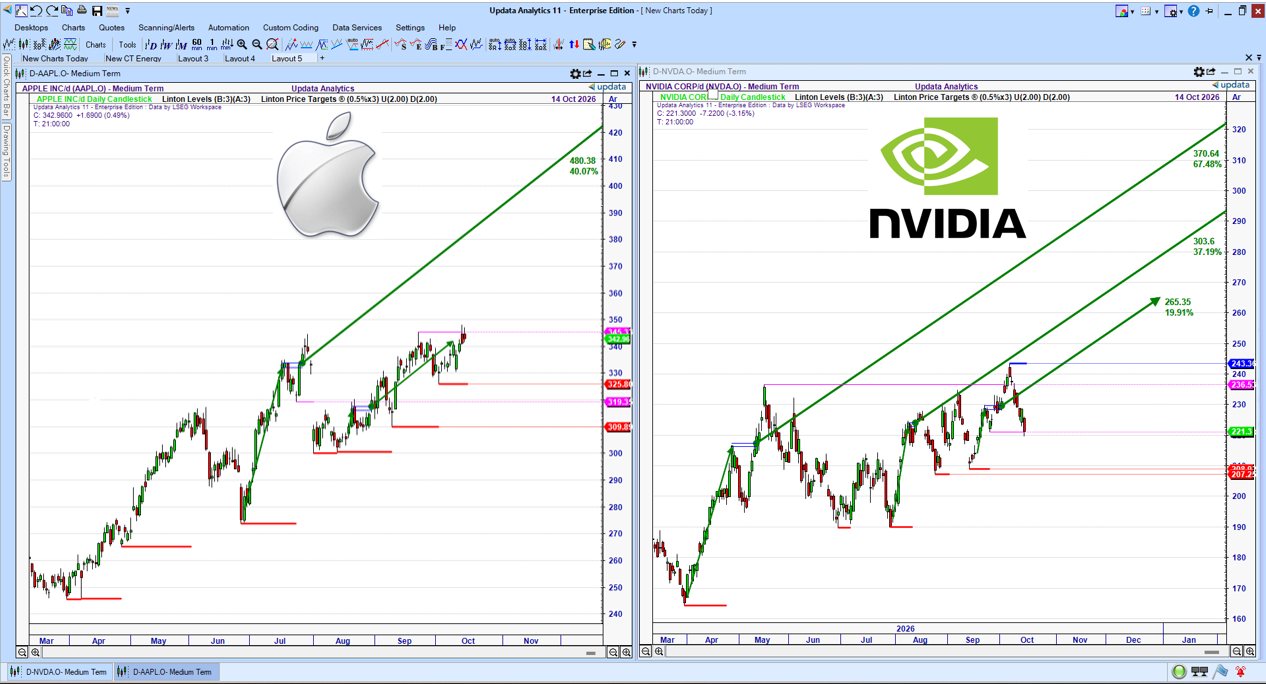
If you had to watch just two stocks for the state of the global stock market, it would be Apple and Nvidia. These two $5 trillion dollar companies now account for 15% of the top 500 US stocks. The fortunes of global stock markets rest increasingly on the performance of these two companies. The US Stock Market has had BAD BREADTH for quite some time!And it’s this weakening Market Breadth that has many market watchers worried. But if stock markets start to sell off globally, it will show up on these charts first.
Looking at the charts, there are key differences (something we look at regularly on chartstoday.com). Apple is currently holding close to an all-time high, while Nvidia stock has struggled to hold the all-time high it made recently. We always look for clear signs that resistance is broken and this is often signalled by such a level becoming support. We often say, the chart needs to break and hold that level. One obvious factor is that Nvidia has three upside Price Targets versus Apple’s lone Target. Both stocks ideally need to make convincing new highs and find support at the previous resistance levels for these price targets to be given more weight. Predicting the Price explores all the nuances we need to be aware of when interpreting Price Targets. They may be rules-based, but it’s the interpretation that counts!
Remember the picture will change. Keep an eye on the shorter-term charts for first signs of such a change.
Targets, Targets… Everywhere!
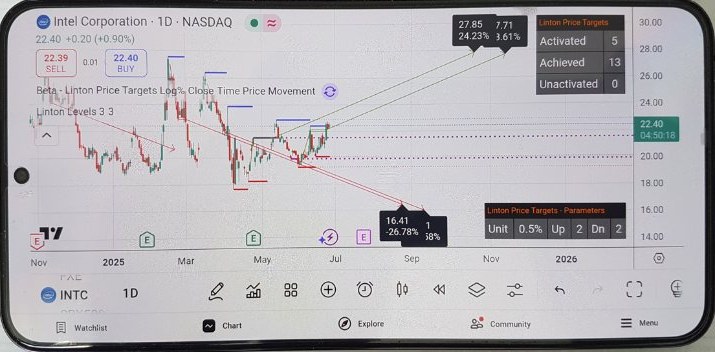
When we developed the Linton Price Targets, we decided to be completely agnostic as to which charting platform they would appear on. TradingView has been a very successful platform for the Targets throughout 2026 and we expect them to be on more new platforms in the coming quarter.
Each platform brings its own advantages. TradingView has excellent global coverage and having the Price Targets on the move on your phone is an advantage, especially if you are a short-term trader.
Price Targets launched on S&P Chart IQ
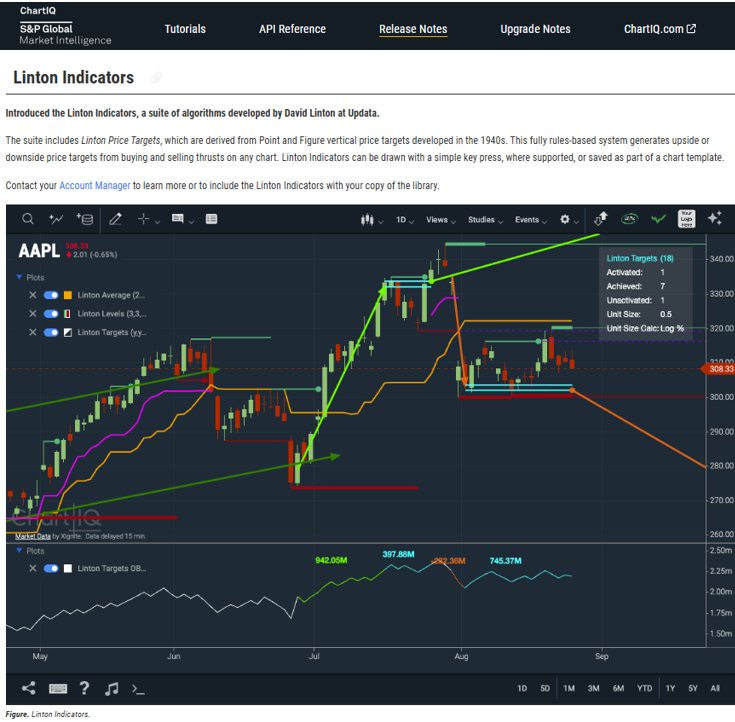
Linton Indicators including Linton Levels and Linton Price targets have been launched on the S&P Global ChartIQ platform. This is significant for Updata because ChartIQ is the charting engine for over 100 finance platforms from banks and brokers to finance portals. This means that any of these platforms can now implement the Price Targets at the flick of a switch. Keep an eye out for a steady increase of platforms being added all the time this way.
MetaTrader is Next
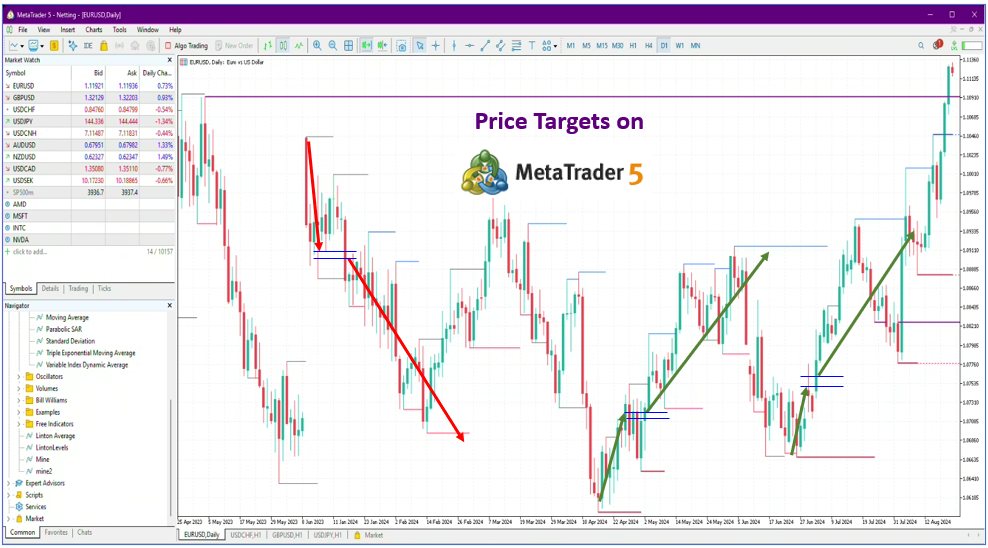
Just in time for the London Prop Trading Expo, Linton Price Targets are launching on MT5. MetaTrader has become the standard for thousands of brokers and potentially millions of traders worldwide. The launch of the Price Targets here will open up a whole new avenue of clients to Updata globally.
Updata Analytics – Our Flagship Product
Updata Analytics comes in two versions Home and Professional (Enterprise). The main difference between the two versions is that the professional product runs on higher cost market terminal services such as Bloomberg and LSEG Workspace. More and more private traders and investors run Linton Price Targets on low-cost platforms such as TradingView. Updata Analytics is for those that want to do more with the Targets.
Updata Analytics brings three core advantages over and above running the Price Targets on other platforms:
- Compatibility with over 20 data services
- Scanning and alerting on virtually any criteria, including Price Targets
- Backtesting trading strategies, again including Price Targets
Constant improvements are being made to the Software and expect to see more on this in future newsletters.
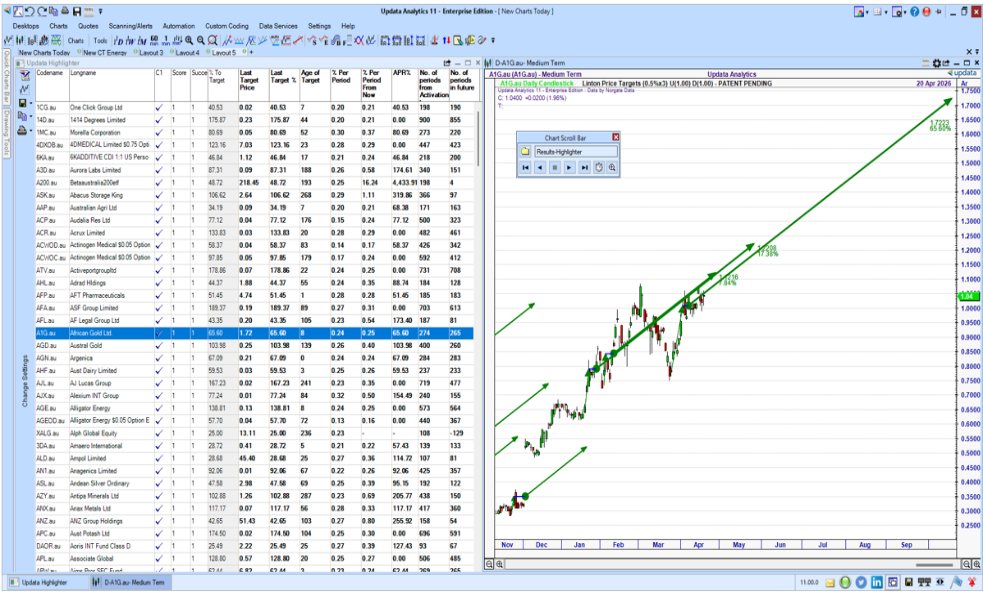
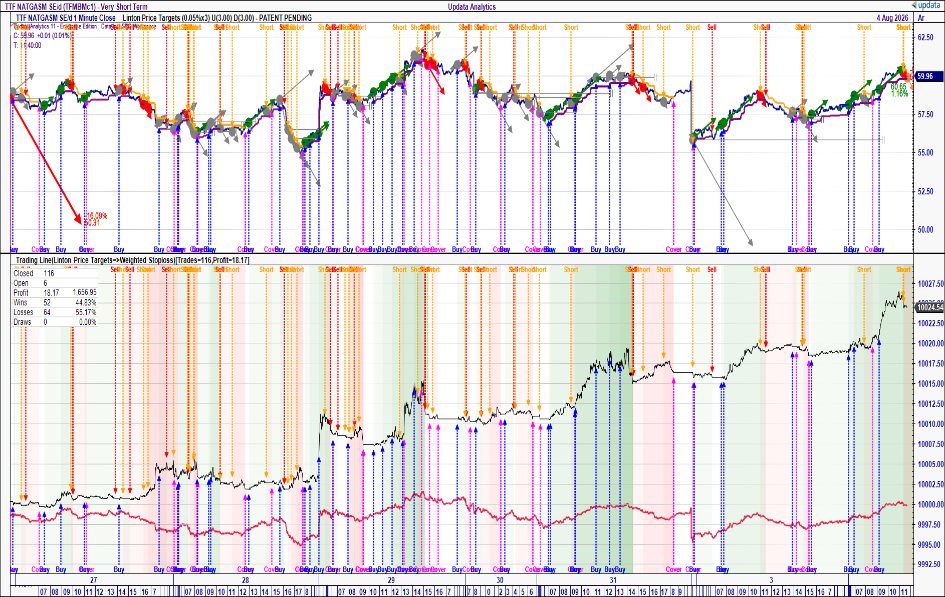
Screens showing Scanning for Price Targets and Backtesting Price targets in Updata Analytics
Market Outlook – Q4 2026
Energy Morning Call Report
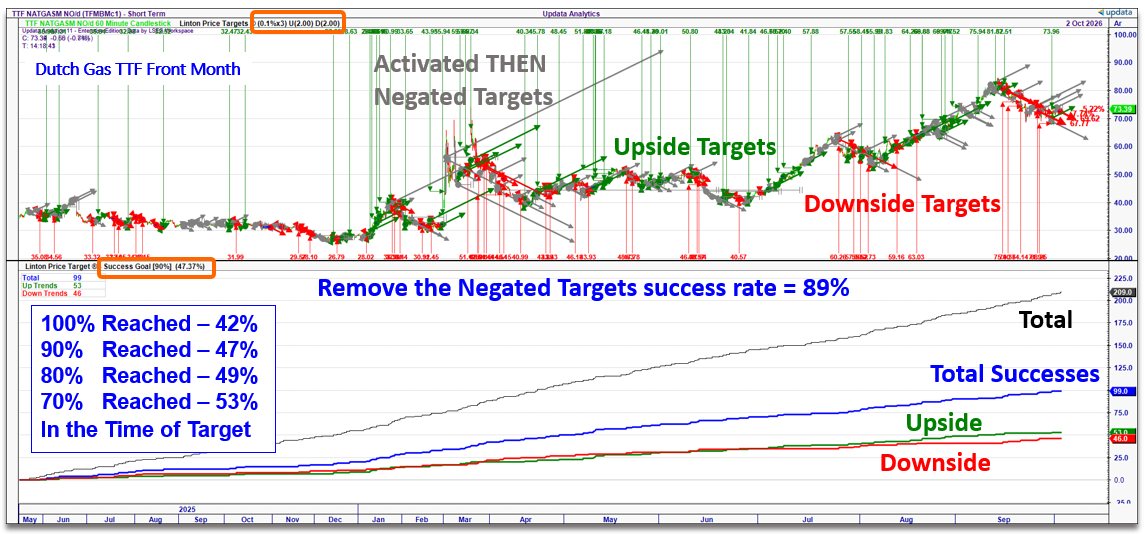
Updata provides premium market analysis for institutional clients including our Energy Morning Call Report first thing every day. The European Energy Trading community has come to rely on this report calling where prices are headed for that trading day. We do this with a red, orange and green traffic light system based on what the Price Targets of the same colour codes are saying.
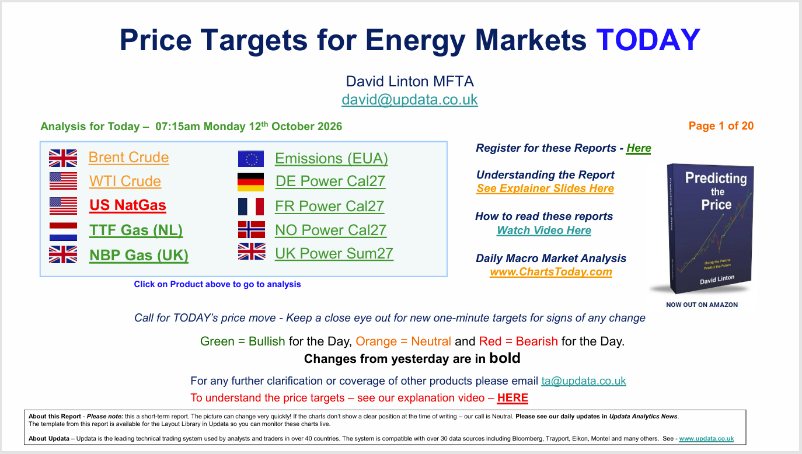
The Energy Morning Call covers: Crude Oil, US, EU and UK Gas, Carbon and EU and UK Power. LNG, Refined Products and Coal are covered in the accompanying daily video commentary. The report is provided as part of the Updata Enterprise software subscription and can also be taken as a standalone service.
If you are an Energy Trader and would like to get the Report each day, take a trial.
What to Look out for in Q4 – by David Linton
Firstly, please remember that the picture can and will change and this is the beauty of Technical Analysis. The chart will tell us when the picture has changed. Another big advantage is that by changing the Time Frame of the Chart, we change the Time Horizon of our view. In my books and training courses, the first Technical Analysis concept I cover is the Time Horizon Table I developed twenty years ago. This is also the bedrock of ChartsToday.com where I constantly switch between the time frames for different views.
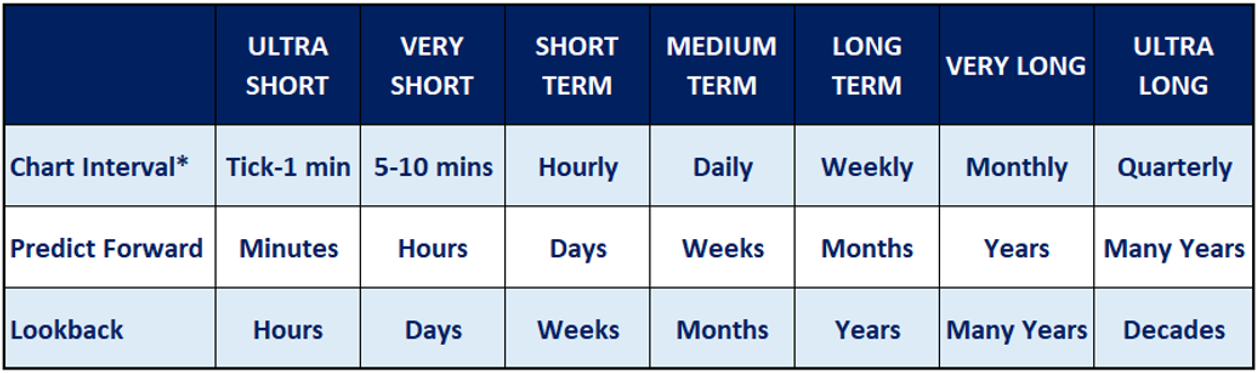
As we think about the coming quarter and into 2027, we need to focus on weekly charts for months ahead, with daily charts for weeks ahead. Within this we should also take the bigger picture of the monthly charts into account.
Forex, Bonds, Stocks, Commodities and Precious Metals
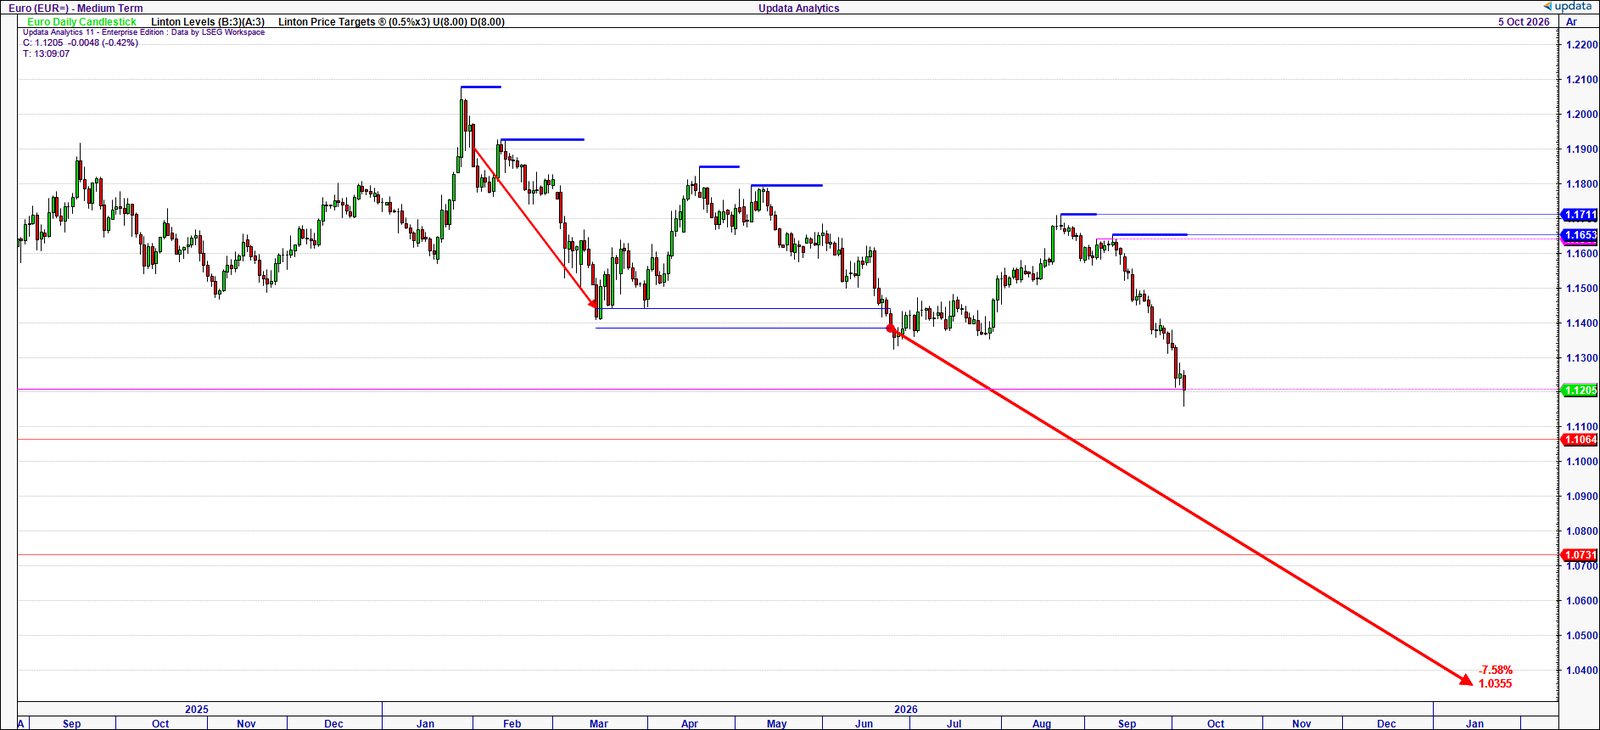
My analysis work follows a format on how these five key asset classes are performing within traditional market super cycles. Many market commentators are calling the end of US dollar dominance, but that is not what the charts are currently saying. The Dollar Index is making new 18-month highs. This is largely driven by the Euro falling to new lows against the Dollar. But it is not all USD strength, the Yen seems to have turned after successful Bank of Japan intervention has changed the daily trend and the Dollar has fallen steadily against the Chinese currency for two years now.
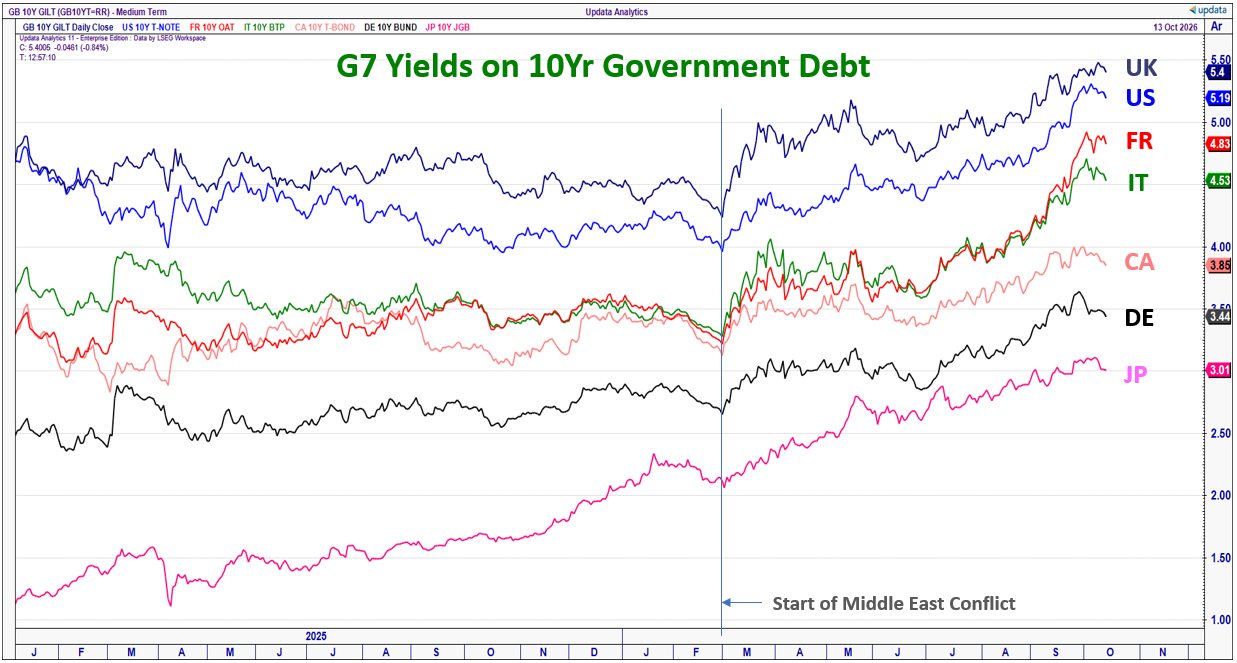
The big news this year has been in the bond markets. But really the long-term trend for bonds changed a few years ago. See Page 202 of Predicting the Price for the monthly chart of US 10Yr treasury yields. This is what I call ‘The Death of the Death of Inflation.’ We are in a new paradigm and it is not limited to the UK which we mostly hear about. Even the relatively stable German bond market has seen the strain of rising yields. Here the German 10 Year Government Yield has given seven upside Price Targets on the daily chart in the last 18 months. That is a lot of buying thrusts. All but two have been met. That’s a lot of bullish confirmation. Watch for periods of respite for low points generating the next buying thrust. This will all make sense to you if you have already read Predicting the Price.
Stock market performance in Q4 will be heavily tied to the fortunes of the mega caps (already covered) and a deteriorating bond market with higher yields could start to weigh heavily on stocks. Two things to watch.
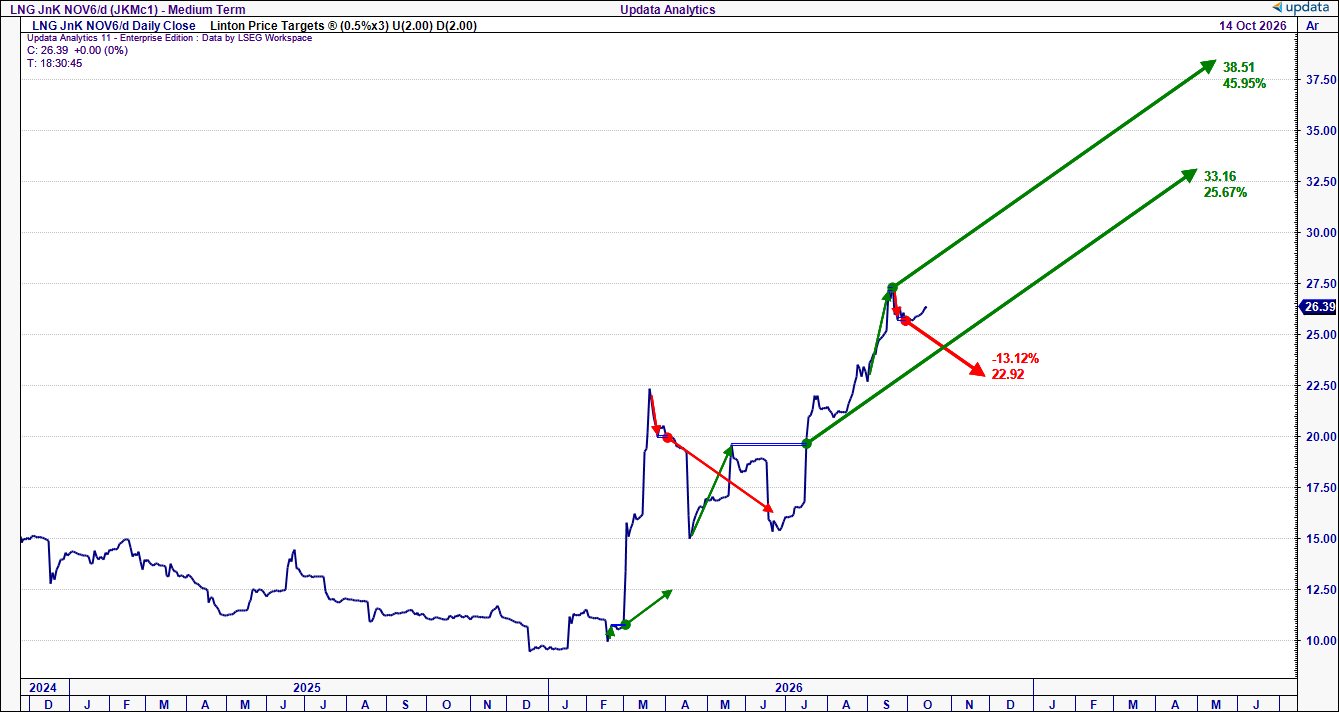
Commodity prices have taken off this year with the global geo-political situation. Energy prices are rocketing with crude oil and refined products remaining elevated. This alone will have an impact on the US mid-term elections leading to more political uncertainty which the bond markets hate. Coal, Gas and Power prices have all surpassed their March peaks when the Iran war broke out. LNG, Asia’s fuel of choice, shows no signs of topping now potentially driving inflation higher. Other commodities that have risen sharply include: Copper, Cocoa, Sugar, Oats, Maize, Rice and Cotton.
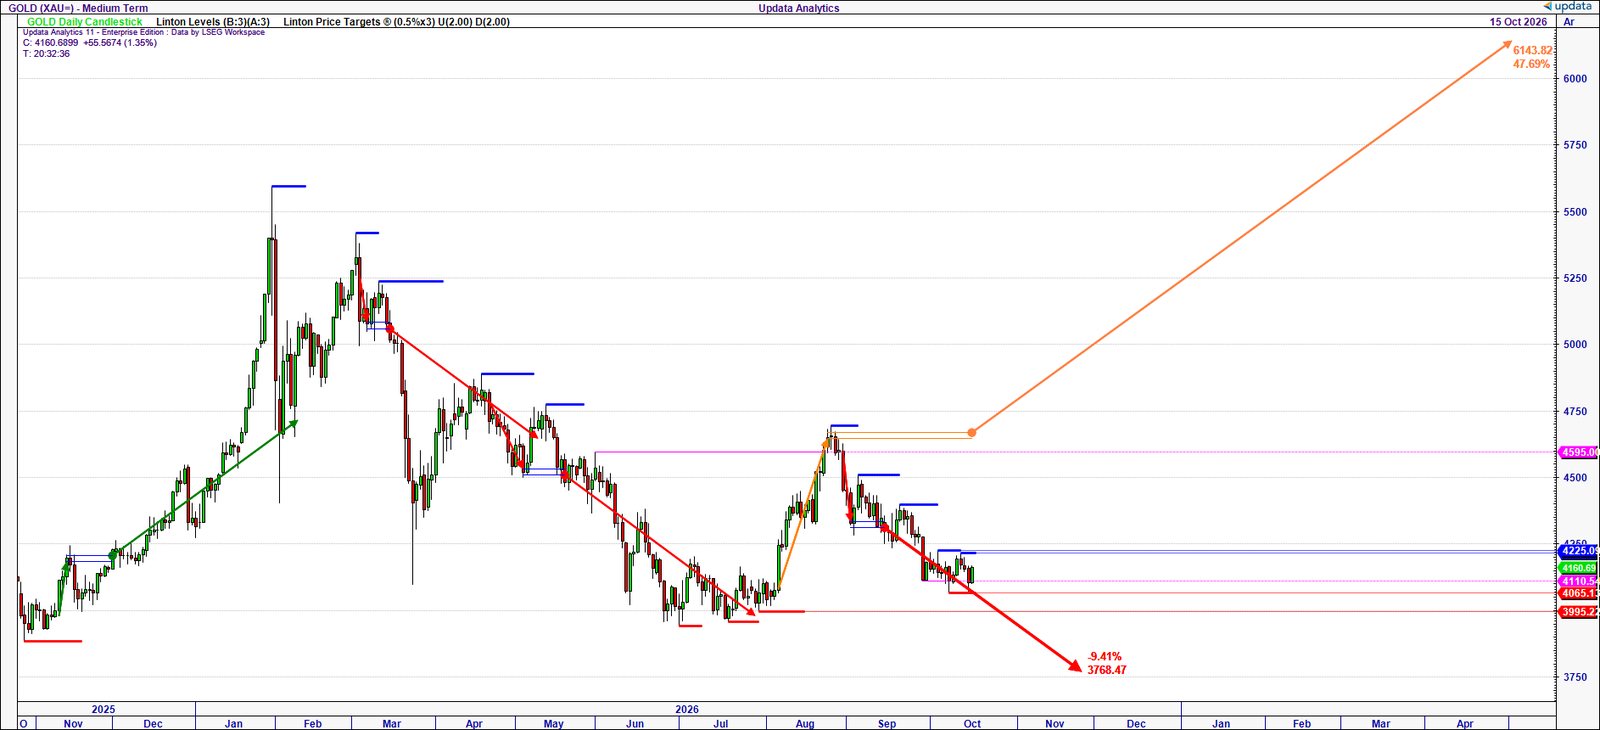
Precious metals are last in the super cycles to rise dramatically. We saw signs of this in Q1 this year with gold and especially silver prices rocketing. Strong support for gold at $4,000 needs to hold and a move above $4,700 activates a big upside Price Target.
Disclaimer – The contents of this newsletter are purely educational and do not constitute financial advice.
